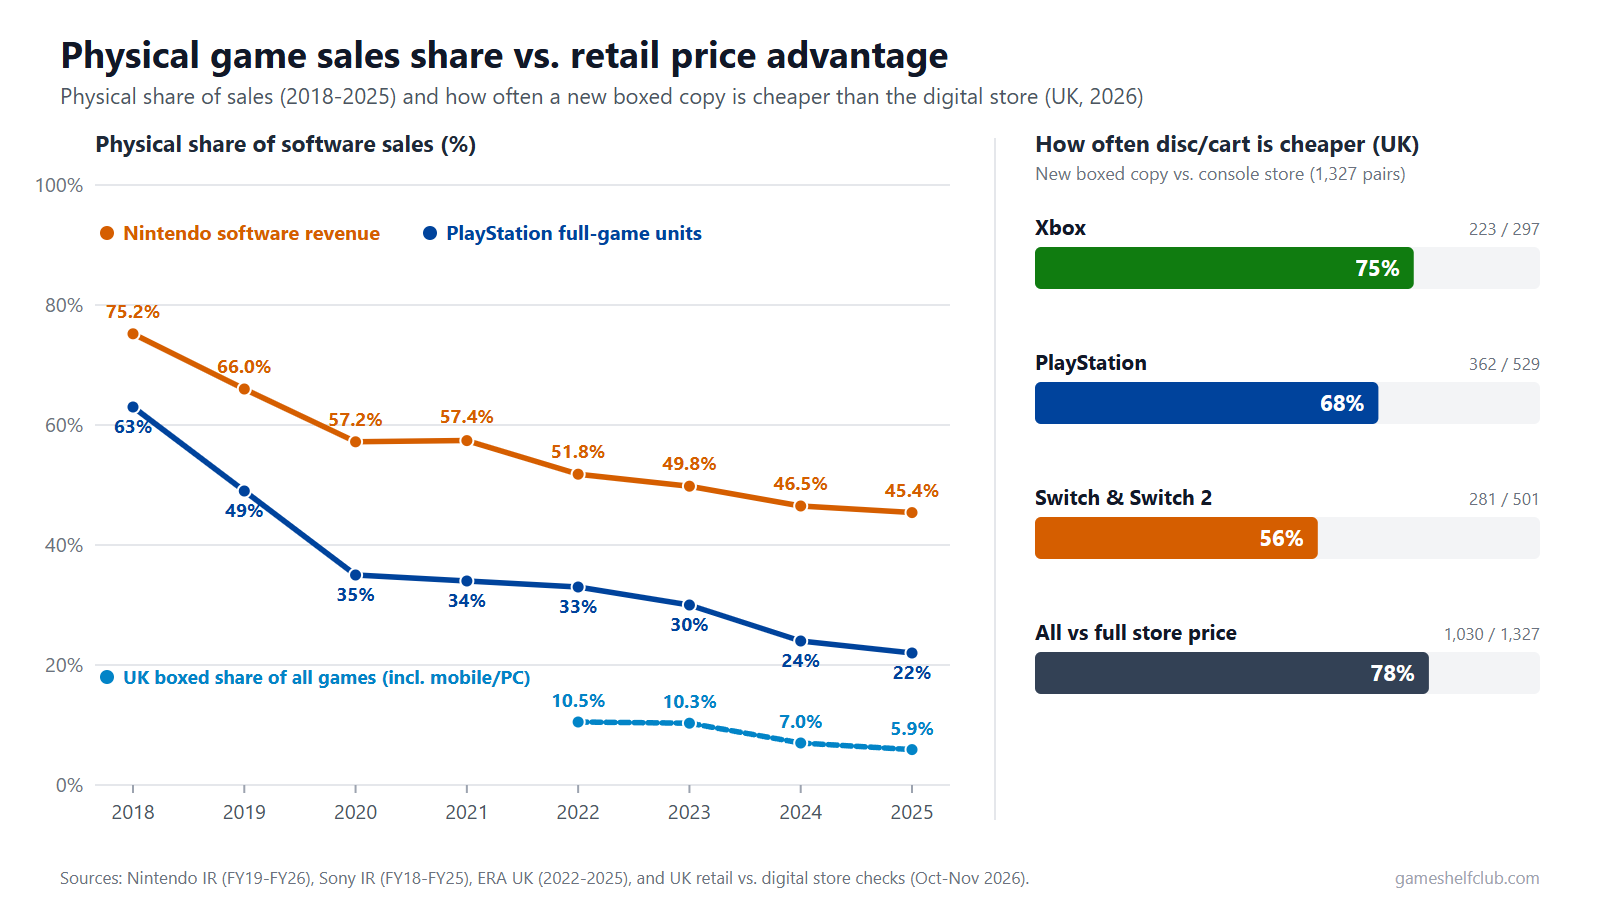
Sony publishes, every year, what share of PlayStation full games were sold as downloads: physical copies fell from 63% in 2018/19 to 22% in 2025/26. Nintendo publishes, every year, how much of its software sales came from digital copies. We took that figure for the eight years to March 2026 and turned it round: the rest is cartridges and discs. In the year to March 2019 physical copies were 75.2% of Nintendo's software sales. In the year to March 2026 they were 45.4%.
Nintendo: physical share by year
| Year to March | Digital (Nintendo) | Physical | Source |
|---|---|---|---|
| 2019 | 24.8% | 75.2% | Nintendo results |
| 2020 | 34.0% | 66.0% | Nintendo results |
| 2021 | 42.8% | 57.2% | Nintendo results |
| 2022 | 42.6% | 57.4% | Nintendo results |
| 2023 | 48.2% | 51.8% | Nintendo results |
| 2024 | 50.2% | 49.8% | Nintendo results |
| 2025 | 53.5% | 46.5% | Nintendo results |
| 2026 | 54.6% | 45.4% | Nintendo results |
Nintendo's digital figure includes downloadable versions of packaged games, download-only games, add-on content and Nintendo Switch Online, so the physical share here is a share of all of that, not of full games alone.
PlayStation: physical share of full games by year
| Year (April to March) | Digital (Sony) | Physical | Source |
|---|---|---|---|
| 2018/19 | 37% | 63% | Sony supplemental information, page 8 |
| 2019/20 | 51% | 49% | Sony supplemental information, page 8 |
| 2020/21 | 65% | 35% | Sony supplemental information, page 9 |
| 2021/22 | 66% | 34% | Sony supplemental information, page 9 |
| 2022/23 | 67% | 33% | Sony supplemental information, page 10 |
| 2023/24 | 70% | 30% | Sony supplemental information, page 10 |
| 2024/25 | 76% | 24% | Sony supplemental information, page 12 |
| 2025/26 | 78% | 22% | Sony supplemental information, page 12 |
Sony's ratio counts full games only, with no add-ons or PlayStation Plus, so it is the closest of the three to a plain disc or download split.
The wider market in Britain: boxed console games
ERA, the entertainment retail trade body, reports games revenue in Britain each year, with boxed console games as one line. That total includes mobile and PC games, which are almost all digital, so the share is much lower than Nintendo's and the two lines should not be compared point for point.
| Year | Boxed console games | Source |
|---|---|---|
| 2022 | 10.5% (stated by ERA) | ERA |
| 2023 | £495.4m of £4,831.7m: 10.3% | ERA |
| 2024 | £324.4m of £4,617.2m: 7.0% | ERA |
| 2025 | £318.9m of £5,365.2m: 5.9% | ERA |
Fewer people buy discs, but the disc is often cheaper
A falling share says nothing about price. In our own checks of new copies against the console store download, the disc or cartridge cost less for 68% of PlayStation games, 75% of Xbox and 56% of Switch: Disc or download: which was cheaper in our price checks?
We read every figure above in the linked Nintendo and ERA documents on 10 November 2026. Capcom also publishes a format split; we left it out because we could not read its own pages.